Skip to content

Custom Dashboards & Internal Tools

Dashboard

Put the state of the business where decisions happen—not in month-end reconstruction.

The useful numbers often already exist, but they are scattered across spreadsheets, notebooks, and separate tools. I connect the data, roles, reporting, and daily controls into one system built around the decisions your team actually makes.

  • Personally led
  • EN / AR bilingual
  • 20 weeks flagship build

01 / When this service fits

This is for you if…

Start with the situation your business is in. The useful scope follows from that—not from a preset package.

Reports arrive too late to matter

By the time the month closes, the decision moment has passed. Liquidity, sales, and receivables should be readable today, not reconstructed later.

Manual reporting eats your team

Someone spends days each month assembling numbers from scattered sources. That's a system's job — with filters, date ranges, and one-click export.

Different roles need different views

The admin sees everything; reception sees billing; staff see their own work. One shared login exposing payroll to everyone is a risk, not a convenience.

The tools don't talk to each other

Invoicing here, expenses there, payroll in a spreadsheet — and no single place where it all connects. Fragmentation is why management flies blind.

02 / What we can shape

What I build

01

Financial intelligence dashboards

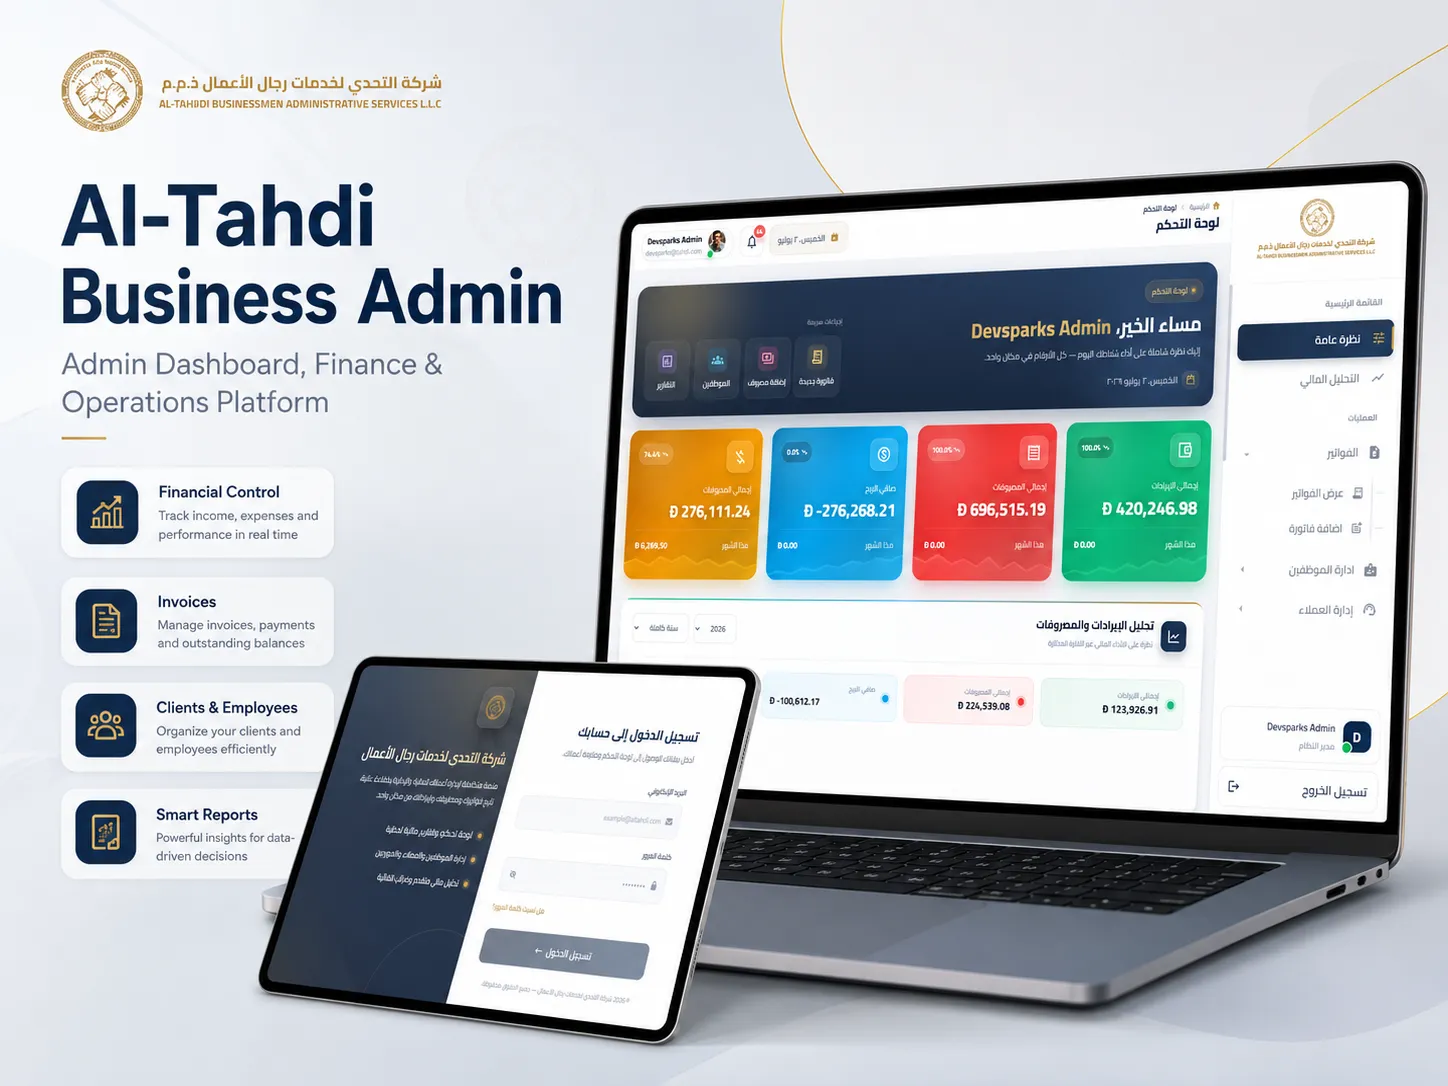
Views shaped around questions such as liquidity, expense distribution, profit margin, receivables aging, tax position, and KPI trends. Altahdi brought those reporting needs into the same system as its operational records.
02

Operations control rooms

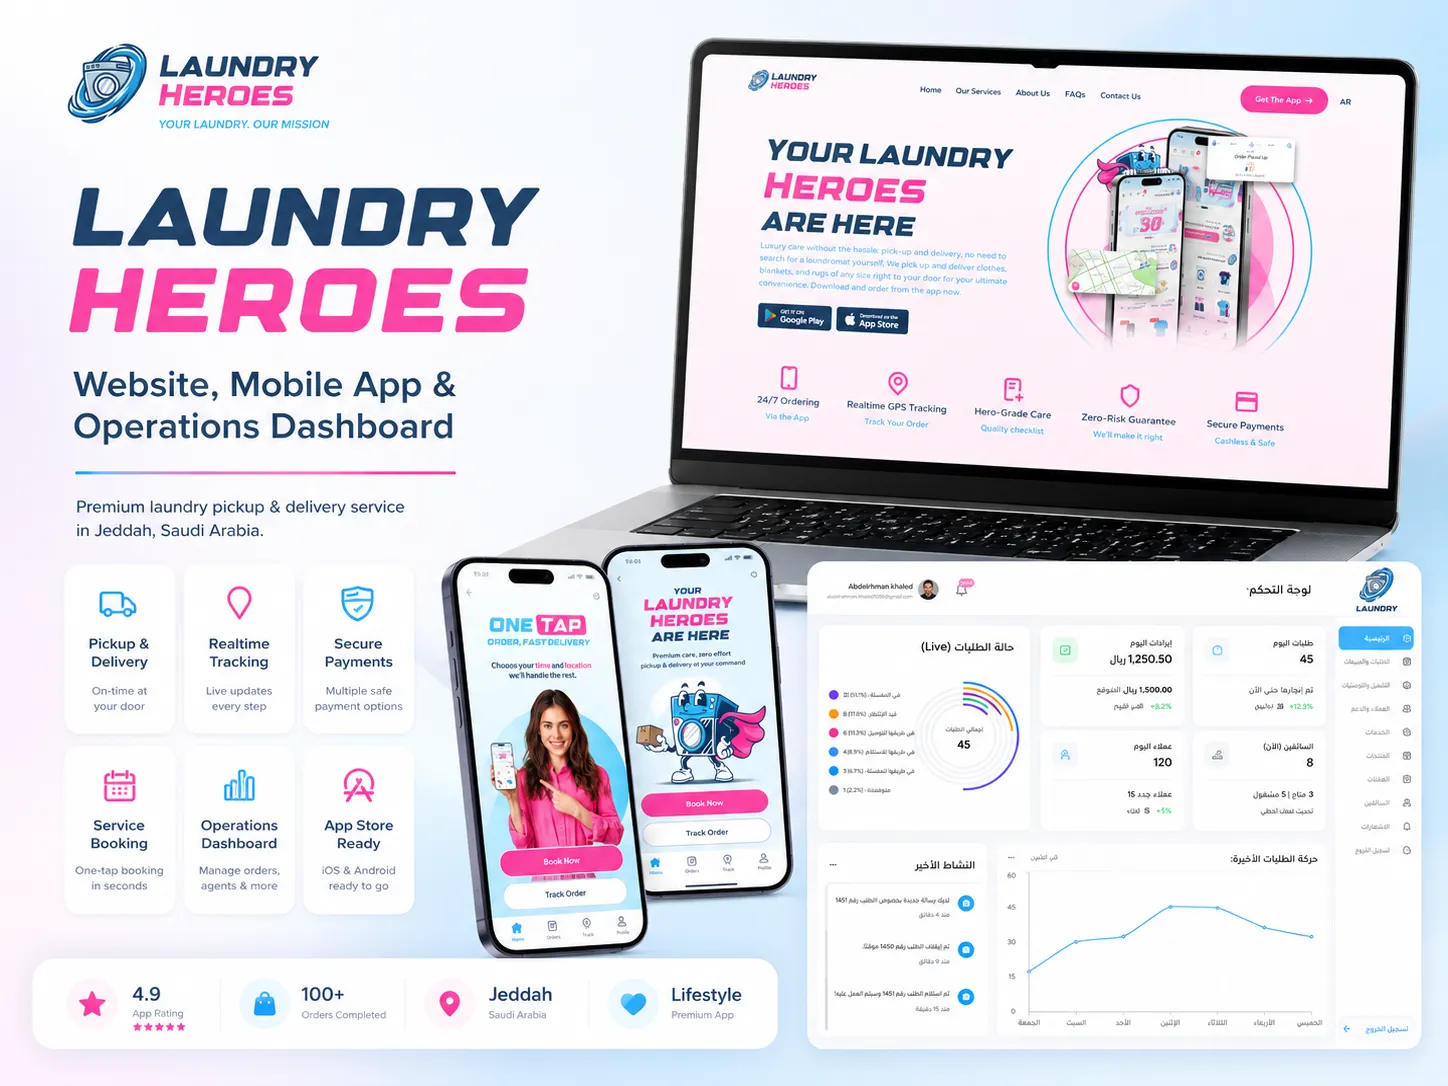
A focused view of the daily operation: order boards, driver maps, pricing controls, and alerts where the workflow requires them. Laundry Heroes connected those controls to the same backend as its customer experience.

03

Reporting engines

Filterable, paginated, and exportable reports across the agreed business dimensions—such as revenues, expenses, services, tax, salaries, and debts—built from reusable data-table patterns.

04

Role-based internal systems

Admin, manager, and staff permission levels with protected routes and notifications for agreed events, reflecting how responsibility is divided in the company.

03 / What the engagement can include

What you get

  • KPIs defined around the decisions the dashboard must support
  • Charts and summaries connected to agreed data sources and update cadence
  • Advanced data tables: filters, date ranges, pagination, export
  • PDF generation for invoices, statements, and formal reports
  • Role-based access with a permission model that mirrors the org
  • Alerts for the agreed events and escalation paths
  • Arabic-first RTL interfaces when your team works in Arabic
  • Training and rollout, screen by screen, with the actual team

8 clear scope · one client-facing lead · visible progress

Technology chosen for the product

  • React 19
  • TypeScript
  • Redux Toolkit
  • Recharts / ApexCharts
  • MUI
  • Firebase FCM

The architectural approach used for the Altahdi reporting system and Laundry Heroes control room—typed workflows, modular state, and explicit data boundaries selected to support ongoing change.

See the approach in a delivered productAltahdi System

04 / How the work moves

How it ships

  1. 1Step 01

    Define the decisions first

    A dashboard is only as good as the decisions it feeds. We start from what management needs to decide weekly, and derive the metrics from there.

  2. 2Step 02

    Model the data honestly

    Where the numbers live today, which records need cleaning, and how agreed data will flow into one consistent model—including a migration and reconciliation plan for historical sources.

  3. 3Step 03

    Build views per role

    Each role gets the screen its day actually needs — entry-fast forms at the front desk, analysis depth in the back office — shipped incrementally by module.

  4. 4Step 04

    Prove it against reality

    Reconcile the new system's outputs against agreed source records and test the workflows with the people who use them. Rollout proceeds when the defined validation checks are satisfied.

06 / Practical answers

What clients usually need to know before we start.

Your Next Decision

Have a dashboard in mind? Let’s define it.

Tell me what you are building, where the work stands now, and what success should look like. We can use that context to identify the first decision worth making.

How do you handle spreadsheet migration?

Migration is scoped around the available sources, data quality, history, and validation rules. For Altahdi, old and new workflows were reconciled during rollout. The project plan states what can be migrated, what needs cleaning, and what should remain archived.

How long does a dashboard or internal system take?

The schedule depends on data sources, roles, integrations, migration needs, and reporting depth. Delivery is planned by module so the team can review working data flows and role-specific views before the complete scope is finished.

Our team works in Arabic. Is that a problem?

It's a strength of mine, not a problem. Arabic-first financial UIs — proper accounting terminology, RTL data tables, bilingual PDF output — are designed from the first screen, which is exactly how the Altahdi System was built.

Can it connect to the tools we already use?

Integration can use APIs, imports, or scheduled synchronization depending on what each existing tool exposes. Feasibility, ownership, and failure handling are documented during discovery before the integration is committed to scope.